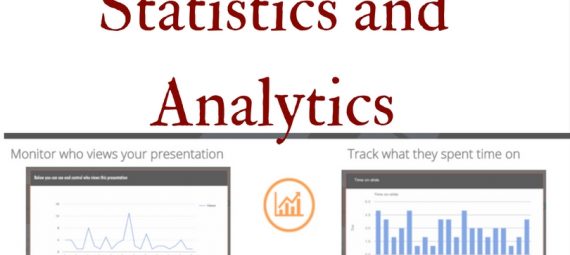
Once you have successfully designed and published your online presentation you don’t have to second guess how it is performing. With Presbee, you will have access to vital analytics to enable you to see how your presentations are performing. By using these statistics you will be able to easily analyse where your business presentation strengths are and where improvements need to be made.
Here’s exactly how Presbee analytics can help improve your business:

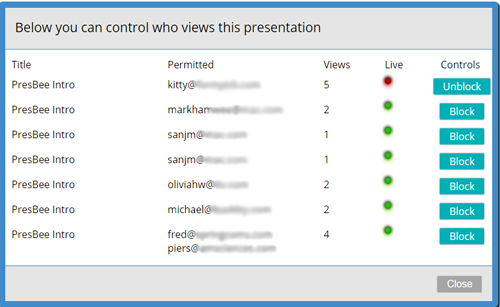
As you can see from the above image, with Presbee you can see who looked at your content, how often they viewed it and when they viewed it. This will allow you to better understand the successful parts of your content as well as understanding who it is popular with. You can also see who is online at the very moment.
From this listing, you can make contact with the potential client that has shown the greater amount of interest and arrange to have a meeting or call to discuss the possibility of working together. By knowing who viewed what, you can cater and target each message to what they are interested in and offer them the right services.
For those whose contracts have come to an end, you can also opt to block these clients/suppliers from viewing your businesses presentation and sensitive information.

Now to go more in-depth. The most important area for you is to view which presentation has performed the best overall. You will possibly see a pattern begin to emerge across the charts which will allow you to focus in on these successful presentations, to find out what information you have provided that may be very useful to your clients, how the overall look has helped and how you can apply this to other published presentations that are not pulling in quite so many views.
This is where you can make your action plan for changes. Look at your content does it vary between your presentations? Are your fonts easy to read? Are you using a poor template in those that are not performing quite so well? How about your images, are these up to scratch? It really is about pulling these presentations apart and comparing the areas that are outstanding and those that are below average. Your ultimate goal is to get a consistent feel across the board and to have all of your presentations hitting those high views.
Once your issues have been identified you can delegate your plans for future online presentations to your staff and direct them in how your slide decks can truly benefit your company. As these are re-published you can feel confident in the fact that you can sit back and watch your statistics grow and therefore hopefully your business too.
If you need more tips on how to improve your slide deck we have plenty of ideas in our other articles so why not check them out?


 Protect your Intellectual Property.